Using showtext in knitr
Thanks to the issue report by yufree and Yihui’s kind work, from version 1.6.10 (development version), knitr starts to support using showtext to change fonts in R plots. To demonstrate its usage, this document itself serves as an example. (Rmd source code)
We first do some setup work, mainly about setting options that control
the appearance of the plots. Notice that if you create plots in PNG
format (the default format for HTML output), it is strongly recommended
to use the CairoPNG device rather than the default png, since
the latter one could produce quite ugly plots when using showtext.
```{r setup}
knitr::opts_chunk$set(dev="CairoPNG", fig.width=7, fig.height=7, dpi = 72)
options(digits = 4)
```
Then we can load showtext package and add fonts to it. Details about
font loading are explained in the
introduction document
of showtext and also in the help topic ?sysfonts::font.add.
While searching and adding fonts may be a tedious work,
package sysfonts (which showtext depends on)
provides a convenient function font.add.google() to automatically download
and use fonts from the Google Fonts repository
(https://www.google.com/fonts).
The first parameter is the font name in Google Fonts and the second one is
the family name that will be used in R plots.
```{r fonts, message=FALSE}
library(showtext)
font.add.google("Lobster", "lobster")
```
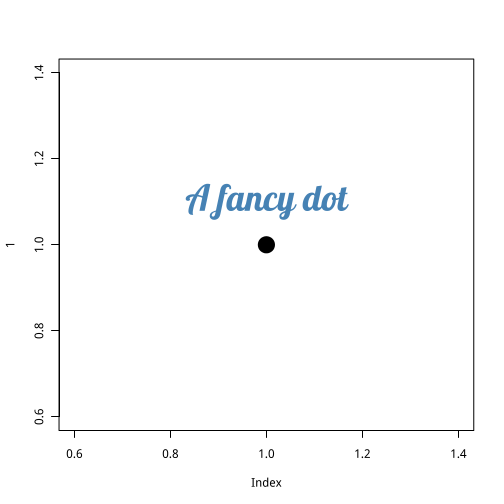
After adding fonts, simply set the fig.showtext option in the code block
where you want to use showtext, and then specify the family name you
just added.
```{r fig.showtext=TRUE, fig.align='center'}
plot(1, pch = 16, cex = 3)
text(1, 1.1, "A fancy dot", family = "lobster", col = "steelblue", cex = 3)
```

